

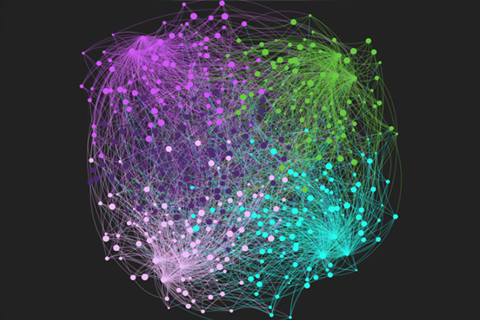
Scientific research often yields vast amounts of data. This is particularly true in computational biology, where a large experiment might examine interactions among dozens or hundreds of genes and the proteins they produce. Prof. Brenda Andrews, director of the Donnelly Centre for Cellular and Biomolecular Research at U of T, says biologists typically represent this information visually using a network graph, in which each gene is identified as a “node” on a network and is connected by a line or “edge” to the genes and proteins it interacts with.
This visualization technique works well for a small number of nodes, but when thousands of interactions are displayed in one diagram, the result, from a distance, can look like a hairball. Andrews says she’s not fond of the term: “To me, it seems derogatory and underplays the importance of the information in these networks.” She prefers “infoball.”
Recent Posts
U of T’s 197th Birthday Quiz
Test your knowledge of all things U of T in honour of the university’s 197th anniversary on March 15!

Are Cold Plunges Good for You?
Research suggests they are, in three ways

Work Has Changed. So Have the Qualities of Good Leadership
Rapid shifts in everything from technology to employee expectations are pressuring leaders to constantly adapt