

Solving a Climate Puzzle, One Tree Ring at a Time
A natural archive reveals how Canada’s arctic climate has changed over the past 1,000 years Read More
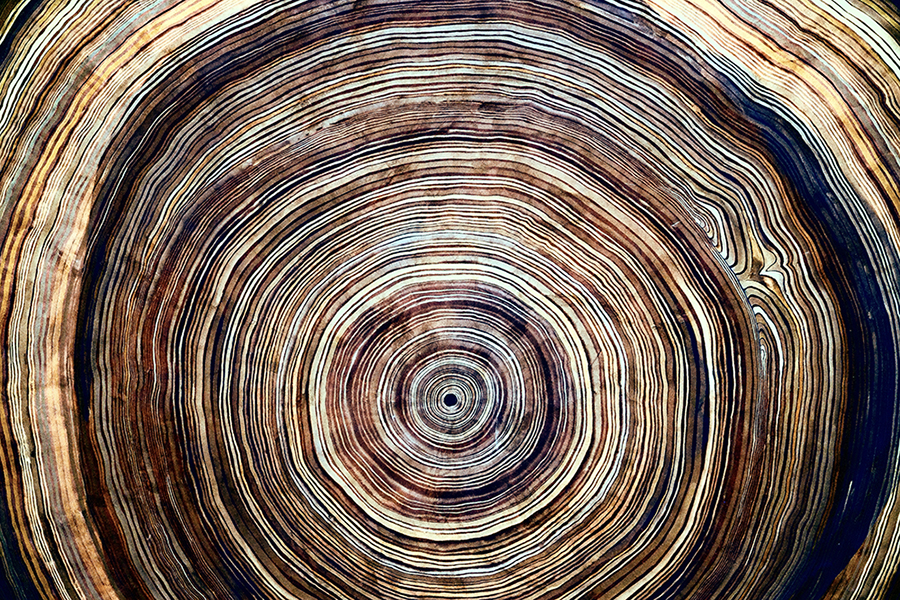
Anyone who has seen a tree stump will have noticed the rings in the wood and, at some point, learned that counting these rings can tell you the age of the tree. This unique growth not only tells us how long a tree stood, but it also holds clues to past weather patterns.
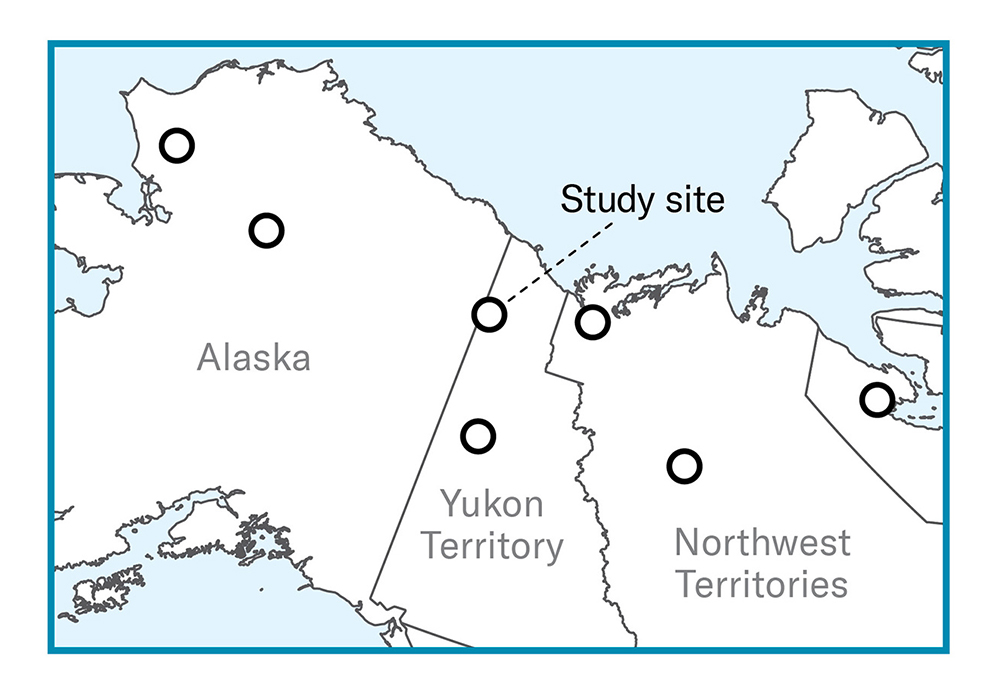
Trevor Porter, a professor in the department of geography, geomatics and environment at U of T Mississauga, is tapping into this natural archive to create a detailed picture of how Canada’s climate has changed over the past 1,000 years. With a network of research sites that span the Yukon and Northwest Territories, his goal is to build a chronology that stretches back long before weather records such as thermometer readings were kept, and to better understand what a future, warmer Arctic may look like.
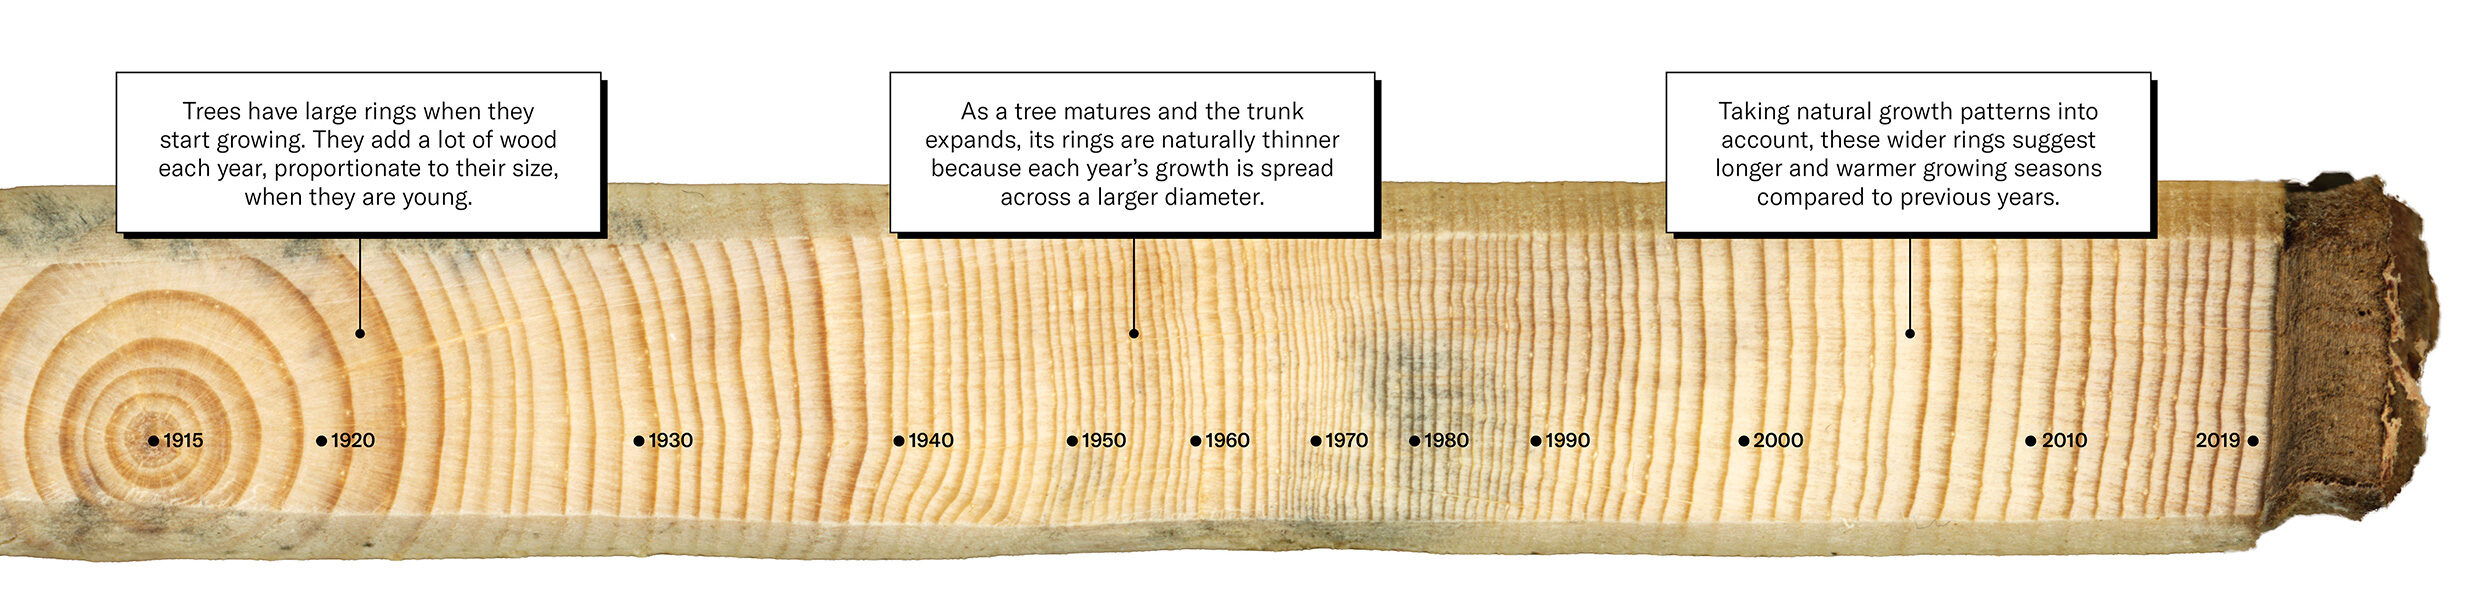
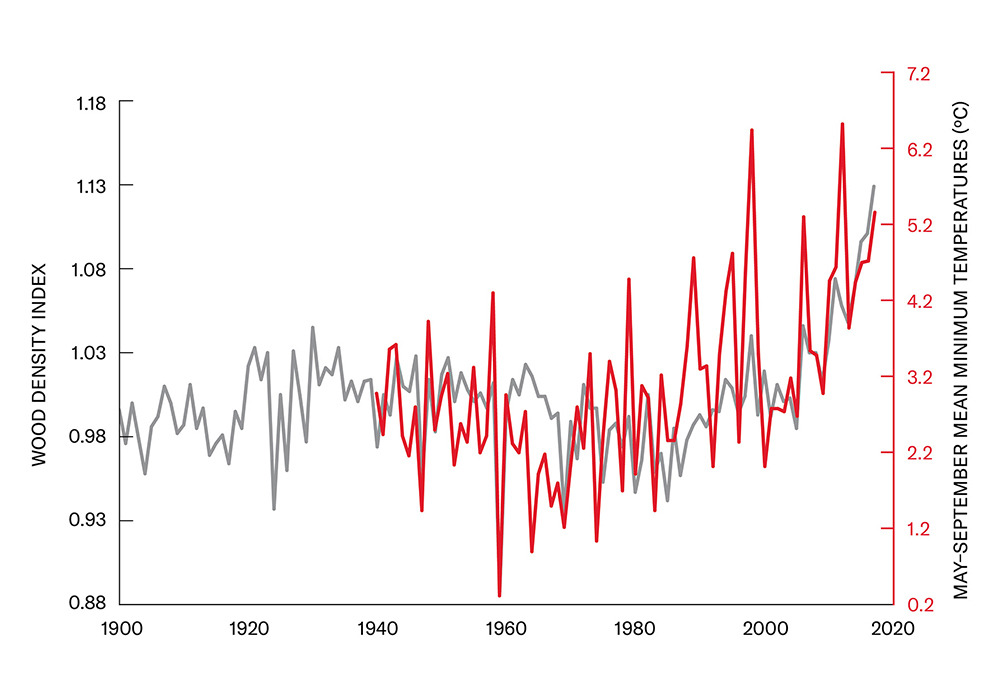
Trees are sensitive to precipitation and temperature, which affect their annual growth. Porter, who is a paleoclimatologist, analyzes the individual rings, examining their width and the density of the wood and then subtracting the natural pattern of growth to see how the environment has changed. “What we learn from tree rings is valuable,” he says.
While there are records that go back 10,000 years or more from other sources – ice cores, sediment and ground ice, for example – tree rings provide detailed, annual information that is exactly dated. One of Porter’s long-term aims is to create a comprehensive record from the region that goes back a millennium. So far, his team has managed 913 years. “I really want to push this farther back in time,” he says, which means looking for dead trees buried in lakes or mud deposits where the wood is preserved.
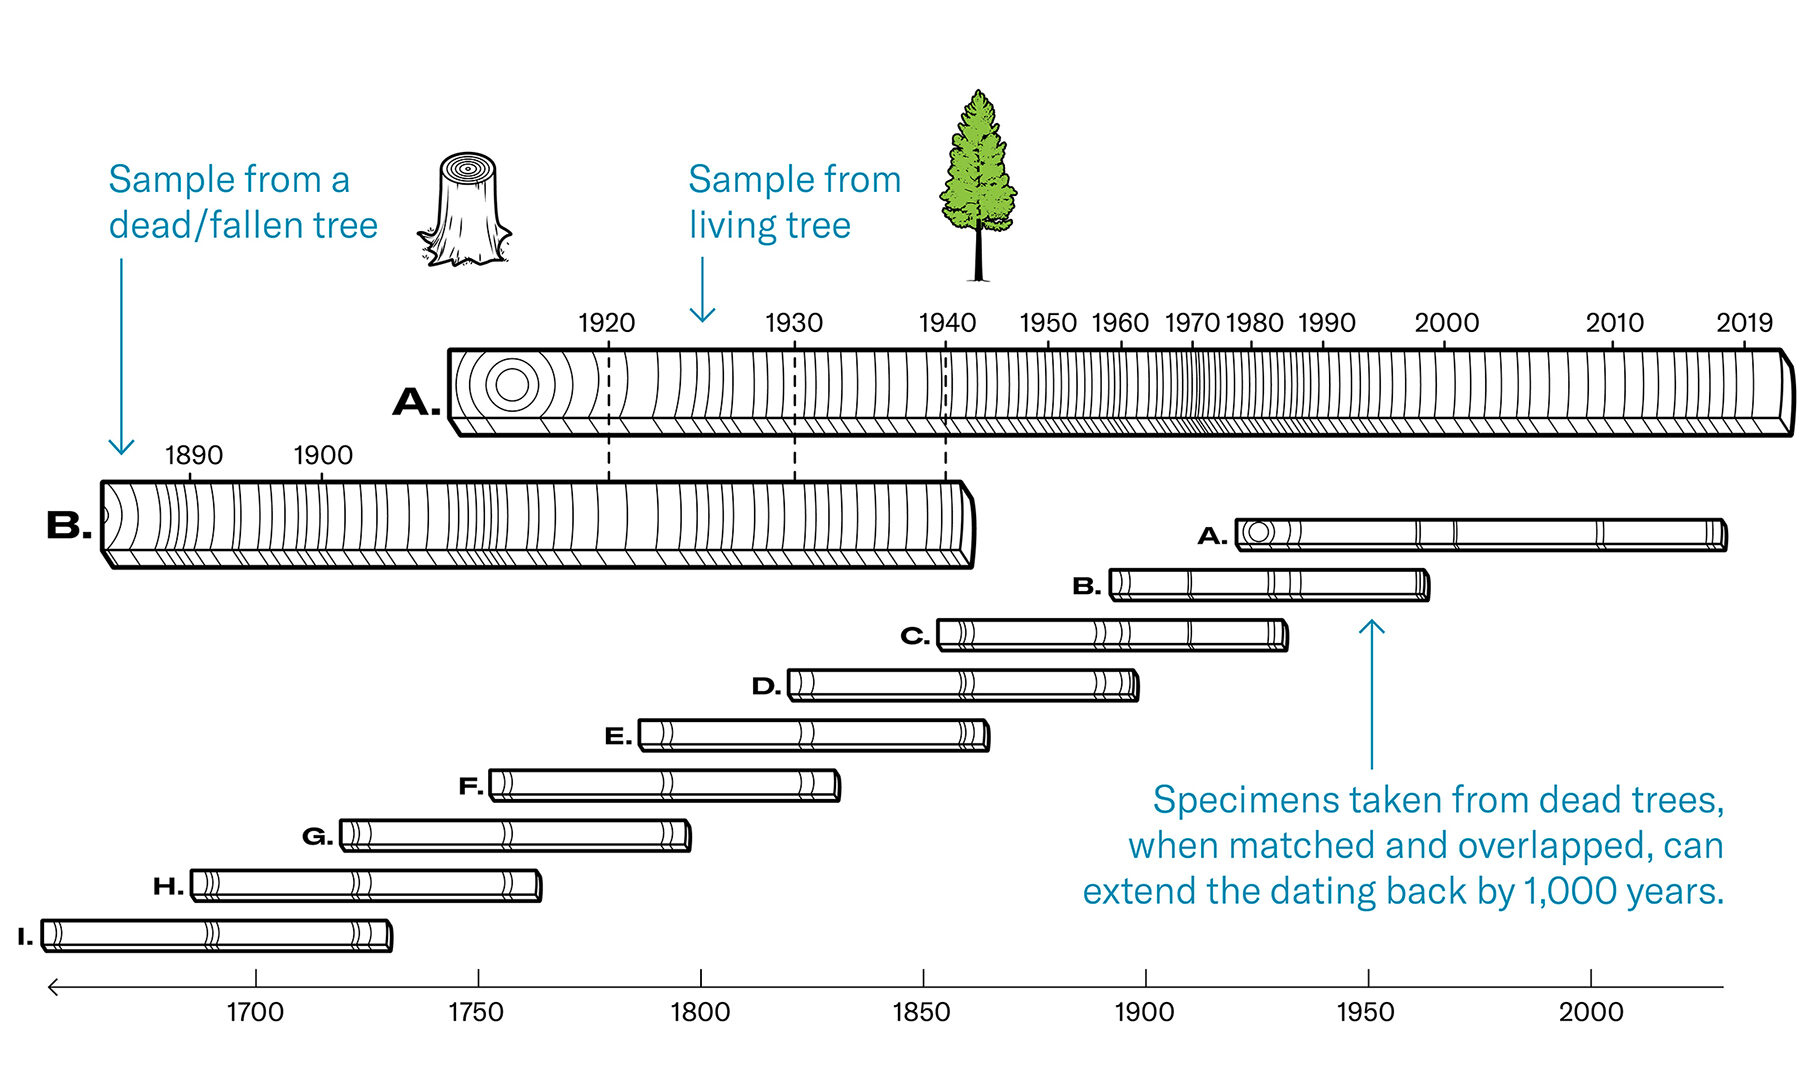
Porter describes the process of reconstructing the past climate using tree rings – a field known as dendrochronology – as a painstaking exercise. Going back further in time requires matching the pattern in a sequence of rings from a dead tree with a section of rings of a living tree from the same geographic area. With a match, the dead tree can be accurately dated. “It’s a bit like solving a jigsaw puzzle,” he says.
A Record in Wood Since the First World War
Most Popular

Teaching AI to Think Like a Lawyer
A platform created at U of T speeds up legal reasoning without replacing human judgment Read More

Never Lose Your Records Again
A U of T startup lets you securely store and share your credentials – without relying on paper documents or waiting for the mail Read More

Canada Needs an AI ‘Moonshot’
Five bold goals to guide how AI could help Canadians in health care, literacy and more Read More
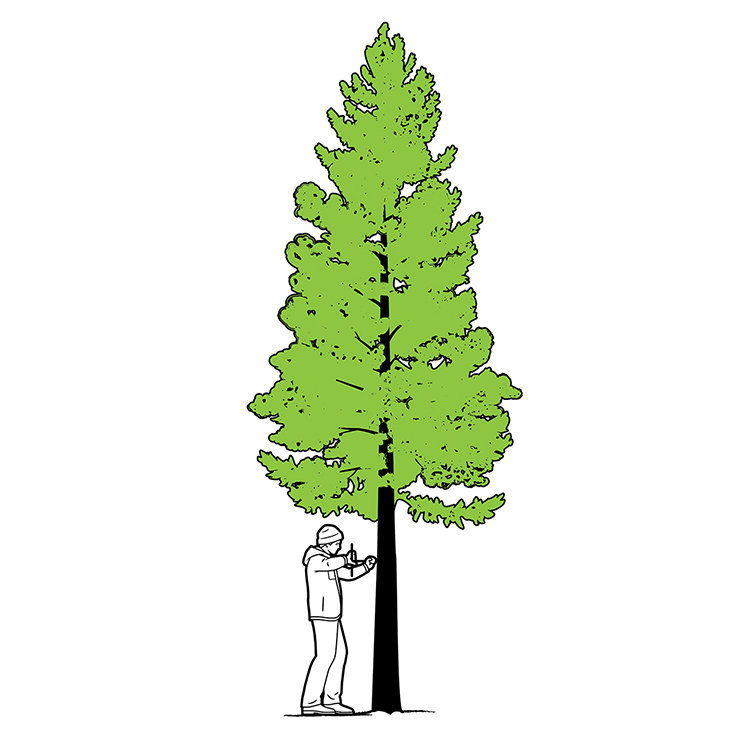
How Core Samples Are Collected
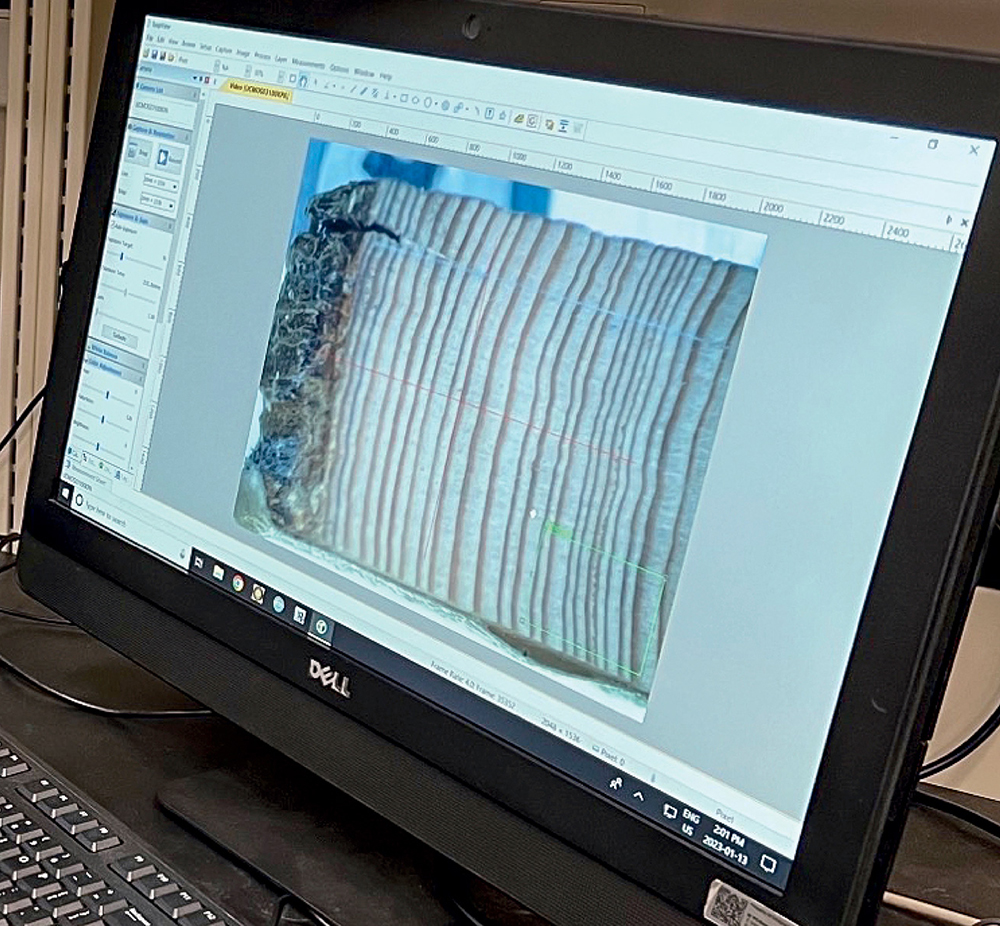
Porter and his students travel to northern Canada during the summer to collect core samples from trees at multiple sites.
Most Popular
Canada Needs an AI ‘Moonshot’
Five bold goals to guide how AI could help Canadians in health care, literacy and more Read More
Teaching AI to Think Like a Lawyer
A platform created at U of T speeds up legal reasoning without replacing human judgment Read More
Never Lose Your Records Again
A U of T startup lets you securely store and share your credentials – without relying on paper documents or waiting for the mail Read More
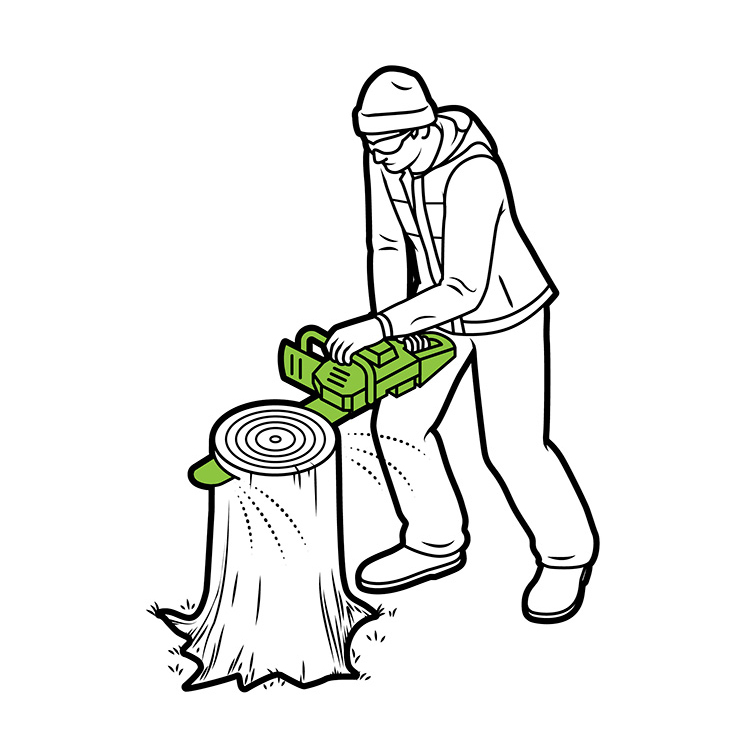

‘You Can’t Talk to One Tree to Get the Full Story’
To gather data further back in time, researchers aim to include information collected from roughly 50 dead trees. Each tree “remembers” the past differently based on various factors.
Most Popular
Teaching AI to Think Like a Lawyer
A platform created at U of T speeds up legal reasoning without replacing human judgment Read More
Canada Needs an AI ‘Moonshot’
Five bold goals to guide how AI could help Canadians in health care, literacy and more Read More
Never Lose Your Records Again
A U of T startup lets you securely store and share your credentials – without relying on paper documents or waiting for the mail Read More
Dead Trees Help Extend the Chronology
Researchers can determine the date of tree rings on dead tree samples with help from living trees, where the dates are known. By lining up rings on a dead tree with samples from living trees, researchers can compare the pattern of growth on the outer most layers of the dead tree. Once they find a match in the sequence, they can extend the tree ring chronology.
Most Popular
Canada Needs an AI ‘Moonshot’
Five bold goals to guide how AI could help Canadians in health care, literacy and more Read More
Never Lose Your Records Again
A U of T startup lets you securely store and share your credentials – without relying on paper documents or waiting for the mail Read More
Teaching AI to Think Like a Lawyer
A platform created at U of T speeds up legal reasoning without replacing human judgment Read More
Most Popular
Teaching AI to Think Like a Lawyer
A platform created at U of T speeds up legal reasoning without replacing human judgment Read More
Canada Needs an AI ‘Moonshot’
Five bold goals to guide how AI could help Canadians in health care, literacy and more Read More
Never Lose Your Records Again
A U of T startup lets you securely store and share your credentials – without relying on paper documents or waiting for the mail Read More

No Responses to “ Solving a Climate Puzzle, One Tree Ring at a Time ”
I'm curious how you can extrapolate back 1,000 years from this study. I don't see the correlation information.
@Paul
This is explained in the section of the article under the heading “Dread Trees Help Extend the Chronology.”
When a researcher removes a core from a living tree, they can precisely date the rings because they know the year of the outer-most layer. Let’s say the living tree is 300 years old and it has a particular sequence of wide and narrow tree rings near its centre -- say, 250 years ago. That sequence is like a barcode and can be compared with samples from dead trees. If that same barcode occurs near the outer edge of a dead tree (preserved in mud or at the bottom of a lake) that lived for 200 years, then that provides a date for the outer rings of the dead tree. In this example, the outer rings in the dead tree date back 250 years, which means the inner rings of the dead tree indicate what occurred 450 years ago. By repeating this process of matching sequences, or barcodes, in older and older dead trees, Prof. Porter can extend the climate chronology further back in time.
It’s important to note that many living and dead trees from an area are used to build this climate history.