

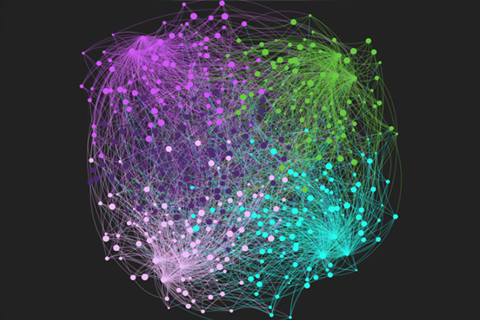
Scientific research often yields vast amounts of data. This is particularly true in computational biology, where a large experiment might examine interactions among dozens or hundreds of genes and the proteins they produce. Prof. Brenda Andrews, director of the Donnelly Centre for Cellular and Biomolecular Research at U of T, says biologists typically represent this information visually using a network graph, in which each gene is identified as a “node” on a network and is connected by a line or “edge” to the genes and proteins it interacts with.
This visualization technique works well for a small number of nodes, but when thousands of interactions are displayed in one diagram, the result, from a distance, can look like a hairball. Andrews says she’s not fond of the term: “To me, it seems derogatory and underplays the importance of the information in these networks.” She prefers “infoball.”
Recent Posts
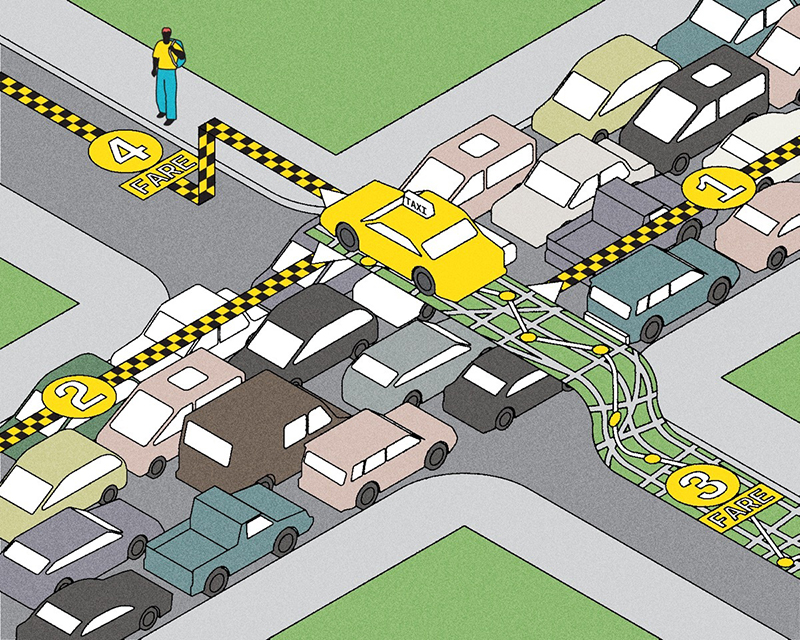
People Worry That AI Will Replace Workers. But It Could Make Some More Productive
These scholars say artificial intelligence could help reduce income inequality
A Sentinel for Global Health
AI is promising a better – and faster – way to monitor the world for emerging medical threats
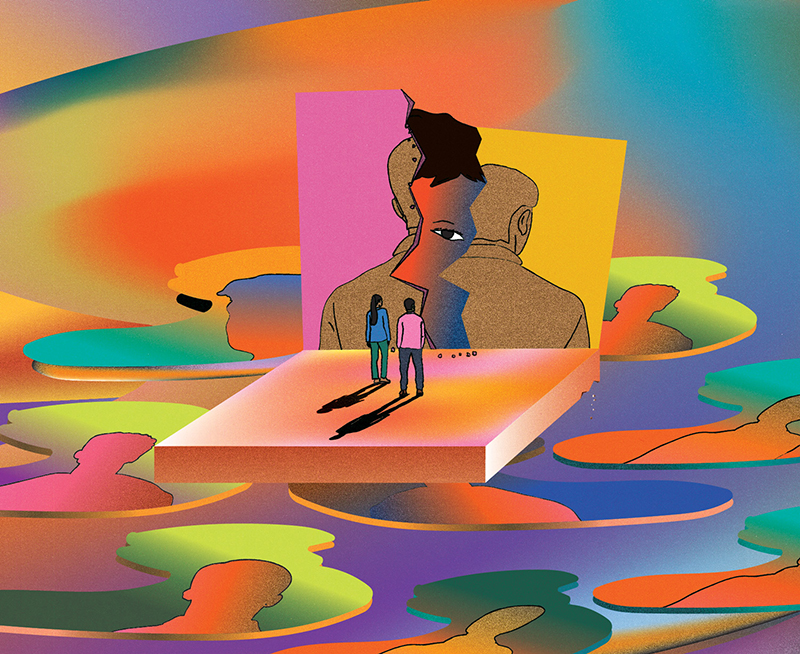
The Age of Deception
AI is generating a disinformation arms race. The window to stop it may be closing