

Just as Google Maps has changed the way we navigate our world, the world’s first “map” of the human liver – completed by a team of U of T scientists – could revolutionize the way we diagnose and treat liver disease. This could have major implications for the one in 10 Canadians with liver disease, and hundreds of millions of people worldwide.
“Mapping” the football-shaped liver is like unlocking a black box. The liver, while crucial for metabolic and immune functions, has long been one of the least understood organs in the body because its cells are exceptionally fragile. This makes it extremely difficult for researchers to study the cells, as they die soon after being separated from the whole. As a result, the standard treatment for end-stage liver disease hasn’t changed in many years. It often involves intensive drug therapies and complex transplant surgery.
Frank Bialystok, a U of T lecturer in Canadian Studies and the Anne Tanenbaum Centre for Jewish Studies, knows this only too well. Diagnosed in his 40s with hepatitis C, likely caused from an unsanitary childhood vaccination in his native Poland, Bialystok languished for more than a year on a transplant wait-list. He was at death’s door when he finally received a donor liver. Then he underwent long-term drug treatment to prevent his body from rejecting the organ. He suffered not only physically but mentally. “There were a lot of dark moments,” he says.
Bialystok was incredibly lucky. The treatment worked, and he’s considered cured. Not everyone is so fortunate. “There was a seven-year-old girl I’d befriended at an event for people who’d had transplants,” he recalls. Diagnosed with biliary atresia, a liver disease that starts in infancy, she’d received a transplant from her dad that was initially successful. Later, though, she developed complications. “They couldn’t save her,” Bialystok says sadly.
“Mapping” the liver represents a big step toward rewriting these scenarios. How big? Gary Bader, a computational biologist at U of T who developed the software for the map, asks us to consider the paradigm shift that occurred with the invention of the microscope in the late 16th century, which would allow scientists to see cells – the fundamental units of life – for the first time. “The field of genomics has now undergone a similar shift,” says Bader, a professor at the Donnelly Centre for Cellular and Biomolecular Research. “This new technology represents a new type of microscope, very similar in scope to that first breakthrough.”
The Human Genome Project, completed in 2003, was successful in identifying and cataloguing our genes – the instructional “recipes” inside our cells that tell them how to function. That research advanced our understanding of how certain genes and mutations are responsible for specific diseases, but it had limitations: it allowed researchers only to measure genomic properties of millions of cells all together – a “soup” of cells. But single cell genomics, a groundbreaking technology that underwent a boom in 2015, now enables researchers to measure gene expression in individual cells, generating a vast output of data on thousands or even millions of single cells very quickly. It’s like comparing a world map from a century or two ago, with rough outlines of countries, mountains and large rivers, to today’s online maps that detail laneways, creeks and gas stations. This will help scientists see cellular changes that occur as, or even before, disease begins.
As a computational biologist – someone who uses sophisticated computational methods to study biological systems – Bader quickly recognized the power of single cell technology. In early 2017, he was the only Canadian invited to join the organizing committee of an ambitious international project called the Human Cell Atlas. Like a traditional atlas, the Human Cell Atlas would contain a full set of detailed maps, but its geography would be parts of the body. Ultimately, the atlas would categorize all the tens of trillions of cells that make up a human, showing all cell types, where each type is located and which genes each type expresses. Understanding how healthy gene expression works can help researchers identify what goes wrong in disease and help drug developers target therapies and avoid harmful side-effects.
Excited to be at the vanguard of this revolution in medical research, Bader considered many types of organs and tissues that he would want to map. It’s not so much that he chose the liver; it’s more that the liver chose him. First, Toronto is a world leader in liver research, having North America’s largest clinic for liver disease. Second, the organ transplant program at Toronto’s University Health Network (UHN) – also the largest in North America – has access to healthy donor tissue. Third, U of T’s Medicine by Design program connected Bader with experts in liver immunology, transplant and regeneration, propelling the research forward. It took only nine months for the team to produce a liver map to add to the Human Cell Atlas, making Bader’s team the first in the world to map a solid organ in the human body.
What does a liver map look like? Like maps of countries, the liver map contains a colourful diagram, placing all the cells on a two-dimensional plot. Cells that are similar to each other are placed close together and colour-coded accordingly. The map illustrates the degree of similarity among various cell types, the number of cell types and the number of cells per type. The map also includes a massive treasure trove of data: about 500 gigabytes. “The data that we’re getting from the single-cell technology is the cleanest and most informative data we’ve ever seen from any genomics technology,” says Bader.
That first map, published in October 2018, includes data from about 8,500 cells taken from five human liver samples. While a liver has billions of cells, it’s not necessary to analyze them all in order to make a detailed map, Bader says. “We can make a map from thousands of cells and have a pretty good chance of seeing most cell types.” In fact, Bader’s team has already identified two distinct new types of macrophages, or specialized immune cells, in the liver: one that’s pro-inflammatory and the other that’s anti-inflammatory.
This could have huge implications for donor liver recipients, says liver transplant surgeon Ian McGilvray, who is research director at UHN’s Soham & Shaila Ajmera Family Transplant Centre, a U of T professor in the department of surgery and a member of the liver mapping team. Currently, to dampen the immune system and prevent rejection of the donor organ, transplant patients have to take heavy drugs that can come with devastating side-effects, including increased risks of kidney damage, infection and cancer.
But targeting specific immune cells in the liver – for instance, stimulating the response of the macrophages that reduce inflammation and dampening the response of the ones that promote it – could mean that in future, patients may not need anti-rejection drugs at all. “The liver map is going to be a really cool way of looking at how to change how an organ functions,” McGilvray says. “And for transplant in particular, it could be mind-blowingly revolutionary.” Ideally, it could make diagnosis of liver disease so much quicker and treatments so much better that transplant itself may ultimately become obsolete.
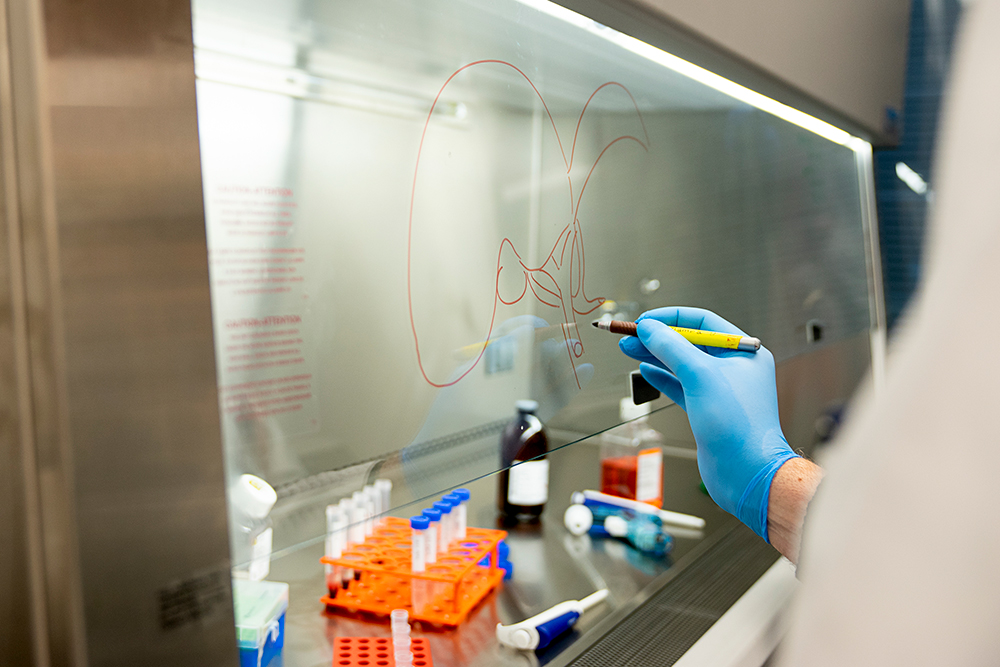
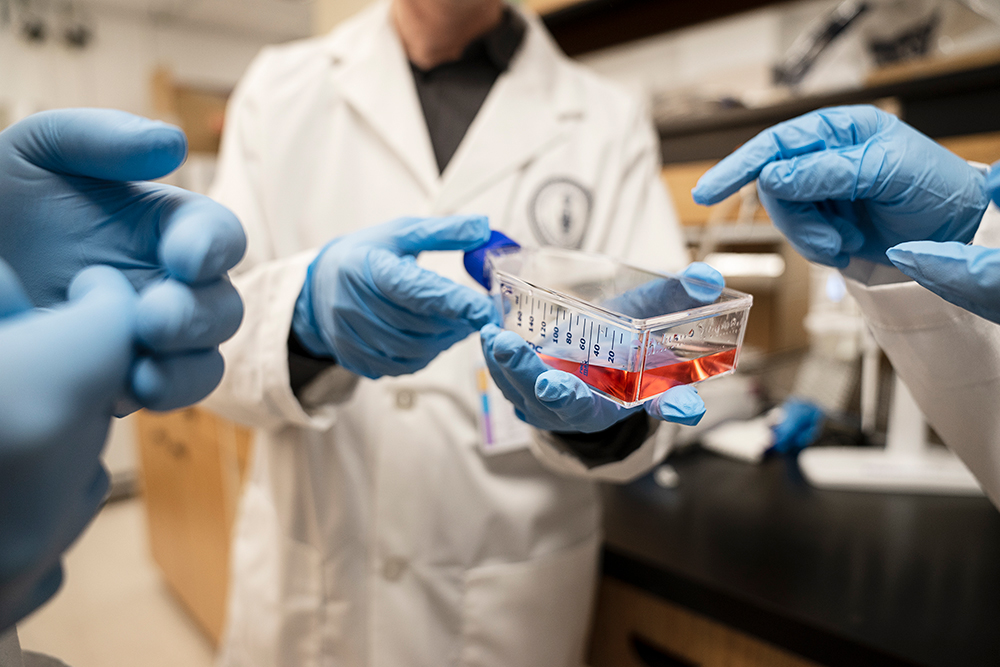
Here’s how the team created the map. The starting point was the caudate lobe, a small, jalapeno-sized section of liver that UHN surgeons routinely remove from a healthy donor organ before transplant to allow for easier access to the liver’s blood vessels. Normally the lobe was tossed away as surgical waste. But the researchers recognized that while any healthy liver tissue could be used for mapping, these caudate lobes offered a ready supply.
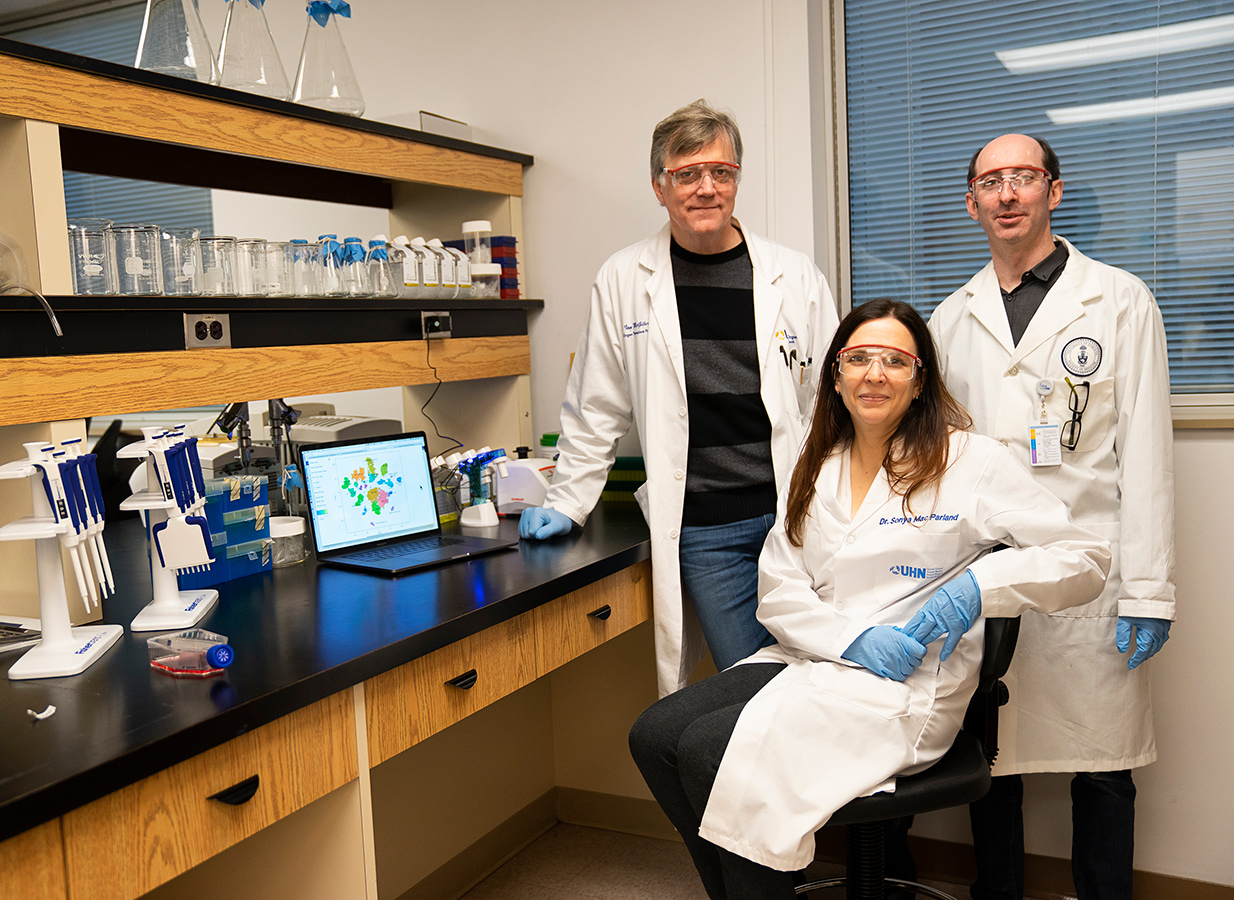
Next, since individual liver cells are very fragile once they’re removed from the rest of the organ, the team had to figure out how to keep them alive long enough to be studied. “What you want to avoid doing with an organ like the liver is mash the tissue up and use a lot of mechanical ways of separating it, because the cells would die,” says liver immunologist Sonya MacParland, a UHN scientist and U of T professor in the departments of laboratory medicine and pathobiology, and immunology.
UHN researchers had already spent six years painstakingly studying how to chemically separate these delicate cells, so a lot of the legwork was already done even before single cell sequencing became available. MacParland successfully developed a method of introducing certain enzymes, via needles into the lobe’s own blood vessels, to break down the tight connective tissue and gently and quickly separate the cells so they could be sequenced for the map. It takes less than an hour for cells to go from the operating room to MacParland’s lab to the sequencing facility, which are all in one building. “I never dreamed that we’d be able to look at the liver with this degree of resolution,” she says. “It’s going to lead to extremely exciting discoveries and new treatments for liver disease, and it’ll be faster than you might think.”
Since different liver diseases affect different groups – for example, biliary atresia affects children, while primary sclerosing cholangitis affects mostly men between ages 30 and 50 – the team is now aiming to study the liver across races, genders and ages. It has since made a second map, using 50,000 cells from 20 samples. The mapping remains an ongoing project, with new, detailed maps on the way thanks to funding from sources including the Chan Zuckerberg Initiative, the charitable operation established by Facebook founder Mark Zuckerberg and his wife Priscilla Chan.
The entire Human Cell Atlas, of which the liver map is a part, exemplifies global collaboration. It’s a free, open-access, central resource for data sharing, which leads to rapid advances in knowledge. Members include more than 1,600 scientists from 70 countries targeting 14 organ systems.
The liver mapping project, which relies on the synergy of interdisciplinary groups, is an example of collaboration at its best. “No pun intended, but it’s really put the Toronto community on the map,” says Bader. “We’re definitely seen as a leader, and it says something about Canadians, about how well we work together and the culture of sharing and collaboration that exists in Toronto and at U of T.”
Recent Posts
People Worry That AI Will Replace Workers. But It Could Make Some More Productive
These scholars say artificial intelligence could help reduce income inequality
A Sentinel for Global Health
AI is promising a better – and faster – way to monitor the world for emerging medical threats
The Age of Deception
AI is generating a disinformation arms race. The window to stop it may be closing
4 Responses to “ Mapping the Human Body, One Cell at a Time ”
Excellent writing. I really enjoyed this article. I graduated from U of T in anesthesiology in the 1970s. Thank you for sharing this advanced knowledge.
Great work. I’m looking forward to seeing the differences uncovered in mapping women, children and people of different races!
I found this article very informative and interesting because of its relevance in my research on the ethics of organ transplantation in a globalized world. It reinforces my conception of the unity of humanity -- notwithstanding differences in language, race, gender and the multitude of competing political and economic agendas.
It makes me proud to know that such important research is going on at the university from which I graduated in 1970. Thanks for sharing. I really enjoyed the article, and I will look forward to hearing more in the future.